
Magnetic resonance imaging (MRI) has had a part in clinical trials for more than three decades now. For most of this time, MRI mainly was used for qualitative interpretation and simple structural measurements. However, the role of MRI in new drug clinical trials can involve diagnosis of lesions and determination of their severity, early identification of therapeutic responders to drug treatment and treatment monitoring and follow-up. MRI may also be used to evaluate drug dosing regimens, to gain insight about the mechanism of drug action, and to collect imaging biomarker data which could provide an earlier indication of response to therapy than clinical outcomes.
Clinical trials are increasingly using advanced MRI techniques to help evaluate the efficacy of investigational therapeutics. In the past decade or so, there has been considerable development in MRI methods for the evaluation of functional tissue properties, such as perfusion. Such advanced MRI techniques can be valuable in the drug development process because they can enable a better measurement of treatment-related changes compared to other imaging modalities.
Perfusion is the passage of fluid through the lymphatic system or the circulatory system to an organ or tissue, and it typically refers to the delivery of blood to a capillary bed in tissue. Perfusion imaging done by MRI has been used to assess the intrinsic microvascular properties of tumors before, during and after treatment with anti-angiogenic and vascular-targeting agents.
Features of blood perfusion in the brain detected by MRI now have clinical applications in central nervous system (CNS) cancers, neurodegenerative disease, cerebrovascular disease and demyelinating disease.
Currently, MRI-based perfusion imaging is also being applied to measure changes in inflammation in patients with rheumatoid arthritis and osteoarthritis.
Various perfusion-related parameters can be measured using dynamic contrast-enhanced MRI (DCE-MRI). Other techniques are also applied for perfusion imaging, such as dynamic-susceptibility contrast MRI (DSC-MRI), and dynamic contrast-enhanced ultrasound (DCE-US) or computed tomography (DCE-CT).
“DCE-MRI and other perfusion techniques are very sensitive and can be quite difficult to run within a trial. We [Philips Pharma Solutions, formerly BioTel Research] have successfully ran multi-site DCE-MRI trials,” said Edward Ashton, PhD, VP, Oncology Imaging, Philips Pharma Solutions.
Read on to learn about perfusion imaging techniques and their use for clinical trials, with particular focus on perfusion imaging using DCE-MRI.
Readers can also register to view a recent, free webinar where Ashton discussed various advanced imaging techniques, including perfusion imaging, diffusion imaging, molecular imaging and multi-modality imaging, and their applications for oncology clinical trials.
Introduction to Perfusion Imaging
Perfusion imaging techniques evaluate the rate of flow and the permeability (the ability of contrast material to move from intravascular to extravascular space) that occur in the microvasculature within different tissues. Measuring perfusion-related parameters with trustworthy measurement techniques can give vital diagnostic information about the functioning of tissues and organs.
Why Image Vascular Perfusion?
Early phase clinical trials in oncology of vascular-targeting agents and anti-angiogenic drugs that used data from DCE-MRI perfusion imaging techniques were quite common between 2002 and 2012.
Anti-angiogenic drugs can slow the growth of tumors and sometimes even shrink tumors by preventing them from growing their own blood vessels. While anti-angiogenic drugs prevent the formation of new blood vessels to tumors, vascular-targeting agents selectively obstruct their pre-existing vessels. When the microvasculature within the tumor is destroyed, the tumor is deprived of oxygen and nutrients, and this leads to cell death in the tumor tissue from ischemia and hemorrhagic necrosis.
DCE-MRI-based perfusion imaging can be used to prove or disprove the mechanism of action of vascular-targeting agents and anti-angiogenic drugs by giving a direct window into the drug effects. This is beneficial because DCE-MRI imaging can be done early in the drug development process to confirm if an anti-angiogenic or anti-vascular drug reduces the vascular activity within a tumor.
An Example of an Anti-Angiogenic Therapy in Oncology
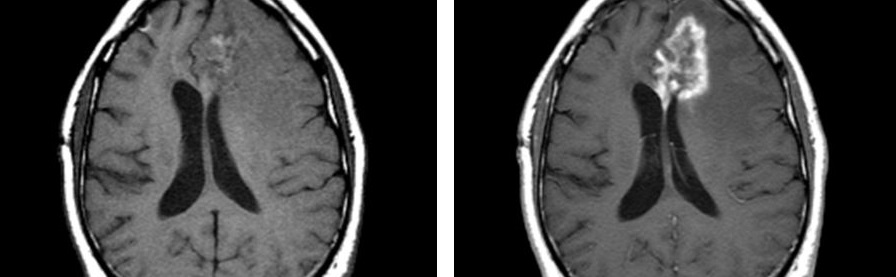
An example of an anti-angiogenic compound working to decrease tumor perfusion is shown by representative images collected by DCE-MRI for a Phase I study (Figure 1); here, the red and yellow areas of the baseline image are areas with very high blood flow, and Liu et al., 2005, showed a quick decrease in tumor vascular parameters on Day 2 after administration of the anti-angiogenic drug AG-013736 , which lasted through Week 4 of treatment. At Week 8 of treatment with AG-013736, the areas of nonperfused tumor necrosis had disappeared.

Figure 1. Representative images collected by DCE-MRI of a patient with adenoid cystic carcinoma that show a decrease in tumor perfusion after exposure to AG-013736, an oral angiogenesis inhibitor. Figure from Liu et al., 2005, courtesy of article co-author Edward Ashton, PhD.
The example above from the Phase I study of AG-013736 shows that DCE-MRI-based perfusion imaging can be a good predictive biomarker. Although the tumor size did not change by Day 2, the tumor vascular parameters had sharply decreased, which shows that there was a good shutdown of the vasculature within that tumor.
Therefore, early DCE-MRI-based perfusion imaging can be used as a predictive biomarker of drug efficacy and to support further investigation and resources into the drug’s development.
An Example of an Anti-Vascular Therapy in Oncology
In a Phase I clinical trial of a vascular-disrupting agent, patients with advanced solid tumors were treated with escalating doses of MN-029 (MediciNova’s denibulin) at three-week intervals. DCE-MRI data were acquired at baseline and at six to eight hours after administering the dose on Day 1 of the first course of therapy. Vascular parameters were calculated using DCE-MRI data, such as Ktrans, which is the volume transfer constant between blood plasma and extra-cellular, extra-vascular space. Ktrans is a useful endpoint for assessing the blood supply to a target lesion because it is related to blood flow and the endothelial permeability-surface area product.
In this Phase I dose escalation study, Ricart et al., 2011, showed a significant negative correlation between the change in Ktrans to the area under the MRI contrast agent concentration-time curve (AUC) for denibulin (Figure 2). This negative correlation indicates the presence of a dose-dependent vascular effect because an increase in drug dose led to a greater reduction of blood flow and hence a greater reduction in the vascular function of the tumors.

Figure 2. In a Phase I dose escalation study of denibulin treatment in patients with advanced solid tumors, data acquired from DCE-MRI indicated a significant negative correlation between the change in Ktrans to the area under the MRI contrast agent concentration-time curve (AUC). Each patient is represented as one data point. Figure from Ricart et al., 2011, courtesy of article co-author Edward Ashton, PhD.
Therefore, the DCE-MRI data from this Phase I study showed that there was a reduction in blood flow and a reduction in vascular function within those tumors. This provides one potential piece of evidence to support moving forward with the clinical development plans for this drug.
Vascular Perfusion Imaging May be Used to Measure Markers of Inflammation
MRI may be used to evaluate the efficacy of treatments for rheumatoid arthritis and to identify early responders because MRI can detect inflammatory features that are sensitive to change. For example, MRI can be used to monitor bone erosion, osteitis (bone inflammation) and synovitis (when the synovium of a joint becomes inflamed) in rheumatoid arthritis clinical trials.
For example, a Phase II study compared the effect of infliximab versus placebo on synovial inflammation measured using DCE-MRI of one wrist in patients with rheumatoid arthritis. This study showed that the DCE-MRI obtained parameters, mean Ktrans of synovium in the wrist and mean Ktrans of total enhancing tissue (synovitis and osteitis), showed significant improvement as early as two weeks after infliximab initiation but not with placebo.
Pure Perfusion Imaging with Arterial Spin Labeling (ASL) MR Perfusion
Arterial spin labeling (ASL) MR perfusion is completely non-invasive because this technique uses magnetically labeled blood as an endogenous tracer, and hence does not require MRI contrast media.
For ASL MR perfusion, water molecules in arterial blood from a feeder artery are magnetically tagged and tracked until they reach the region of interest. Then, the signal difference in the region of interest between the tagged images and control images can be computed to obtain cerebral blood flow (CBF) values (Figure 3).

Figure 3. An overview of the ASL MR perfusion technique to obtain cerebral blood flow (CBF) values. Figure courtesy of Philips Pharma Solutions, formerly BioTel Research.
As a result, ASL is convenient for studies involving healthy participants, pediatric patients where the use of contrast agents might be restricted, patient groups that need repeated follow-up imaging and in patients with certain conditions like kidney failure.
“A disadvantage of this perfusion imaging technique is that it is mainly used for areas of the body where the specific feeder artery is identified. That is easy to implement for brain perfusion imaging because all the blood getting into the brain is coming through the neck. It is also easy to apply for the kidneys because only the renal arteries feed the kidneys,” explained Ashton. “Anywhere else in the body becomes problematic. For instance, it would be difficult to do this for the liver because multiple different feeder vessels to the liver would need to be magnetically tagged. The other option is to tag just one of the feeder vessels to the liver, but that does not capture the full blood flow in the liver.”
For these reasons, ASL MR perfusion is a relatively niche application and is mainly used for perfusion imaging of the brain and kidneys.
Pure Perfusion Imaging with Dynamic Contrast-Enhanced Ultrasound (DCE-US)
Dynamic contrast-enhanced ultrasound (DCE-US) is another perfusion imaging method. The applications of DCE-US for perfusion imaging include evaluating the early effects of anti-angiogenic treatment and for the early evaluation of response to immunotherapy, among others.
An advantage of DCE-US is that the microbubble contrast agents that are used for this technique remain in the vessels, unlike the contrast agents used in MRI or CT. In addition, microbubble contrast is benign, and the DCE-US scan is almost entirely non-invasive. Another benefit is that ultrasound scanners are cheap and widely available.
“The drawbacks of DCE-US include the same drawbacks with ultrasound. There are certain parts of the body that can be imaged well with ultrasound and there are other parts of body that are difficult to image with ultrasound. The deeper into the body you go, the more difficult it is because the sound waves must penetrate in, bounce off something and come back out,” explained Ashton.
“There are also parts of the body like the brain that are almost impossible to image with ultrasound because ultrasound does not travel well through bone. Also, large parts of the thoracic cavity are off limits because the ultrasound does not propagate through air. DCE-US can be done for the liver and for the abdomen without too much trouble,” added Ashton.
Another disadvantage of DCE-US is that the reproducibility is highly dependent on operator training and skill because ultrasound is typically done with a handheld probe. Therefore, when this technique is done over time, it can be difficult to acquire the same ultrasound image in the same region and the same slice.
Perfusion-Permeability Assessment with DCE-MRI
As mentioned above, DCE-MRI has been widely used to assess tumor perfusion in oncology clinical trials and is also currently being used to measure markers of inflammation in rheumatoid arthritis and osteoarthritis.
DCE-MRI involves the acquisition of time-resolved images before, during and after injection of a gadolinium-labeled contrast agent. Contrast agents that have gadolinium shorten the longitudinal (T1) and transverse (T2) relaxation time of neighbouring water protons that are in the vicinity of the contrast agent. This increases the signal intensity of T1-weighted images and reduces the signal intensity of T2*-weighted images.
The change in signal intensity over time in a voxel (the volume element in 3D space measured by the pixel and the thickness of the slice) is related to the concentration of the contrast agent in the tissue of interest. Time-concentration curves for the contrast agent in arterial plasma (commonly called the arterial input function or AIF) and tissue are computed from image data. Parameters such as blood flow, blood volume and vascular permeability surface area product are extracted from modeling performed using the time-concentration curves. A typical time course for contrast agent uptake in arterial plasma and in sample tissue is shown in Figure 4 (Ashton and Shah, 2012).

Figure 4. (a) MRI with a contrast agent. (b) Typical time course for enhancing tissue and plasma. The signal intensity on the y-axis is usually converted to millimolar (mmol) concentration of gadolinium before estimating parameters. Figure from Ashton and Shah, 2012, courtesy of book chapter author Edward Ashton, PhD.
The parameters that can be computed from DCE-MRI images include Ktrans, the extracellular volume (ve), the plasma space volume (vp) and the area under the contrast agent concentration-time curve (AUC).
It is challenging to accurately characterize the AIF with 2D DCE-MRI techniques because 2D acquisitions often have large inflow and outflow artifacts within large arteries. The artifacts are due to changing flow rates as individual slices are collected at different periods of the cardiac cycle.
A comparison of images acquired with 2D and 3D DCE-MRI techniques are shown in Figure 5 (Ashton and Shah, 2012). Therefore, it is important to prioritize 3D DCE-MRI acquisition techniques for most applications.

Figure 5. DCE-MRI images acquired using (a) 2D and (b) 3D techniques. The plots show the changes in signal intensity due to flow artifacts in the descending aorta. The artifacts are more severe in the 2D image. Figure from Ashton and Shah, 2012, courtesy of book chapter author Edward Ashton, PhD.
Since DCE-MRI acquires T1-weighted images and T1-weighted imaging is relatively slow, it can be difficult to acquire very rapid imaging which is needed to separate flow and permeability effects. Acquisition time for DCE-MRI is typically three to six seconds per phase but can be even longer. Advancements in acquisition speed can allow for the separation of flow and permeability effects, but this decreases the spatial coverage and/or signal-to-noise ratio, which ultimately reduces the reliability of the measured parameters.
“Therefore, any DCE-MRI protocol — whether it is for the clinic or a clinical trial — must be developed with the specific purpose in mind and with an understanding of the compromises between precision and absolute accuracy,” said Ashton.
Perfusion-Permeability Assessment with DCE-CT
DCE-CT uses the same principals as DCE-MRI, but the images can be acquired faster with DCE-CT. With DCE-CT, an iodinated contrast agent is administered intravenously and the temporal changes in attenuation in blood vessels and tissues are measured from a rapid series of images. The increase in attenuation is proportional to the concentration of iodine in the blood vessels and hence the changes in attenuation over time can be analyzed with kinetic models.
The biologically relevant parameters that can be measured by DCE-CT are perfusion, permeability, relative blood volume (the proportion of tissue that is comprised of blood) and mean transit time (the average time for contrast agent to traverse the tissue vasculature).
Some advantages of DCE-CT are that the imaging can be fast (around one second/phase), and it is simple to implement. However, a major drawback is the need to use ionising radiation during DCE-CT. The need to keep the radiation burden as low as possible limits the total number of images acquired and makes acquisitions like full body DCE-CT extremely difficult to obtain.
DSC-MRI Perfusion Imaging
Another commonly used perfusion imaging technique is DSC-MRI which is acquired with rapid echo planar imaging with an acquisition time of approximately one second/phase.
While DSC-MRI is very similar to DCE-MRI, DSC-MRI relies on a decrease in T2* signal after a gadolinium-labelled contrast bolus passes. A decline in the signal intensity-time curve from susceptibility effects of the contrast agent is related to the concentration of the contrast agent (Figure 6). A basic assumption for DSC-MRI is that the contrast agent remains intravascular.

Figure 6. DSC-MRI neuroimaging. The plot shows the drop in the signal intensity-time curve which corresponds to the concentration of the contrast agent. Figure courtesy of Philips Pharma Solutions, formerly BioTel Research.
“Since the contrast causes signal loss in DSC-MRI, the change in the T2*-weighted image is lower relative to the noise in the image than what is seen in T1-weighted images. Therefore, the sensitivity of DSC-MRI is low,” said Ashton.
“Also, echo planar images are very sensitive to susceptibility artifacts, which is something that occurs in particular when there is close contact between a tissue and airspace. So, this technique is not suited for imaging the lungs or abdomen. Instead, this technique is primarily used for neuroimaging, and it can be useful for instance in multiple sclerosis and Alzheimer’s disease trials,” added Ashton.
The hemodynamic parameters that can be obtained from the concentration-time curves from DSC-MRI include the relative cerebral blood volume in a given amount of tissue (rCBV), the relative cerebral blood flow (rCBF) and the mean transit time (MTT) which is the average time red blood cells spend within a determinate volume of capillary circulation.
Philips Pharma Solutions’ Focus on Quality Control
Incorporating advanced imaging techniques like perfusion imaging in a clinical trial is something that is not trivial to do. A team of medical imaging experts is needed to help design and implement the best protocol to acquire and analyze accurate, high-quality data. Philips’ team includes board-certified radiologists, thought leaders, sub-specialty experts and highly trained technicians.
“The way that we [Philips] have managed to successfully run multi-site clinical trials with perfusion imaging is by putting in place a tight system in terms of developing a good imaging protocol,” said Ashton, referring to Figure 7.
“We make sure the sites are compliant with the protocol, developing a solid understanding of the different software models that can be used to do the calculation and picking the correct one, and then having a good, robust analysis process. If you get all those pieces in place, this can be done accurately and reproducibly in a large, distributed clinical trial,” explained Ashton.

Figure 7. An overview of Philips Pharma Solutions’, formerly BioTel Research, focus on quality control.
Philips Pharma Solutions, formerly BioTel Research, is a leading central core lab that supports clinical trials with services, products and technologies for medical imaging, cardiac monitoring and remote data capture. Some of their medical imaging expertise includes imaging for oncology, immuno-oncology, neurology, cardiovascular studies, musculoskeletal studies, liver disorders and metabolic diseases.
To learn about the application of perfusion imaging and other advanced imaging techniques for oncology clinical trials, register to watch the free on-demand webinar.
This article was created in collaboration with the sponsoring company and the Xtalks editorial team.
Join or login to leave a comment
JOIN LOGIN